No engineering background needed. This page explains how these tunnels get built, what the cost figures actually mean, what the benchmark projects did, and — the question everyone asks — how long it takes to pay for itself.
There are only three practical ways to get a tunnel under a street. They differ in one basic thing: whether you open the road from above, or go through the ground from the side. Everything else — cost, speed, disruption — follows from that.
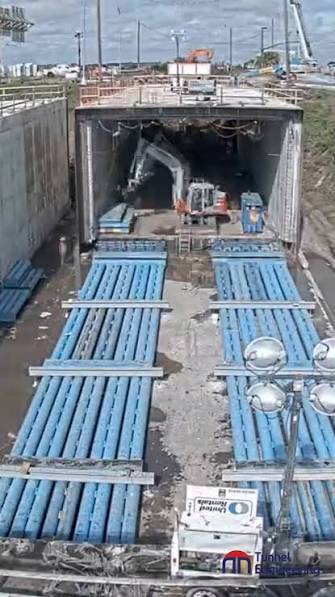
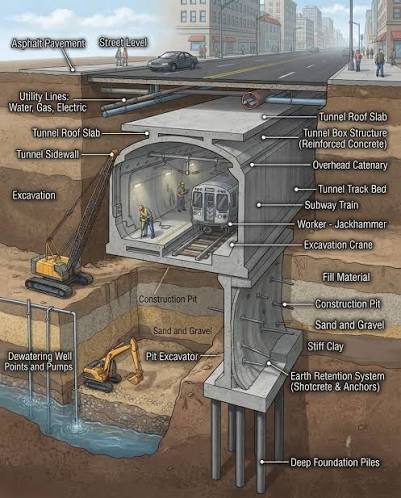
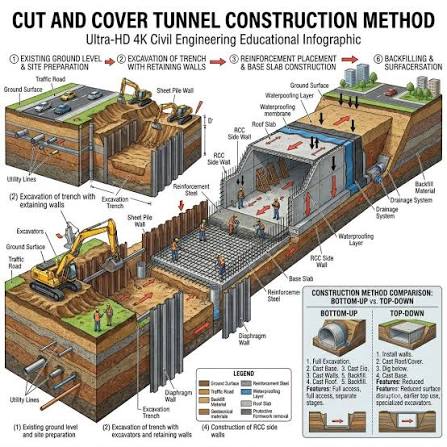
What happens: you dig a long open trench down the street, lower in hollow concrete boxes made in a factory, bolt them together end to end, then bury the whole thing and repave the road on top.
Think of it like: installing a swimming pool. Dig the hole, lower in the ready-made shell, backfill around it, and the surface goes back the way it was.
| Speed | About 0.5–0.6 metres a day. That sounds absurdly slow until you know what it counts — see the note below. |
| Disruption | High. The trench is open, lanes are closed, the shops beside it lose customers. This is the single biggest hidden cost. |
| Cost | Cheapest per metre of the three. |
| Use it when | The land is empty, the road is new, or the corridor is wide enough to work in — new subdivisions, reclamation, greenfield districts. |
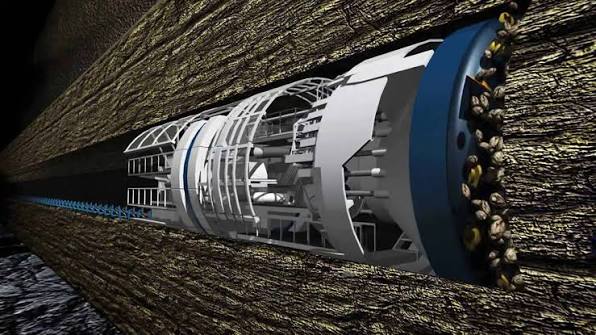
What happens: you sink one shaft at each end of the route. A machine the width of the tunnel grinds forward underground, and as it advances it lines the hole behind itself with curved concrete panels bolted into rings. The street above never opens.
Think of it like: an apple corer pushed through the ground, leaving a finished concrete pipe behind it.
| Speed | 18–28.5 metres a day — but only while the machine is actually boring. Add months at each end for shafts and assembly. |
| Disruption | Minimal. Only the two shaft sites are visible from the street. |
| Cost | Middle. The machine is an enormous fixed cost, so it only makes sense over long distances. |
| Use it when | The drive is longer than roughly 1–2 km and the street above cannot be closed. Below that length you pay for the machine and barely use it. |
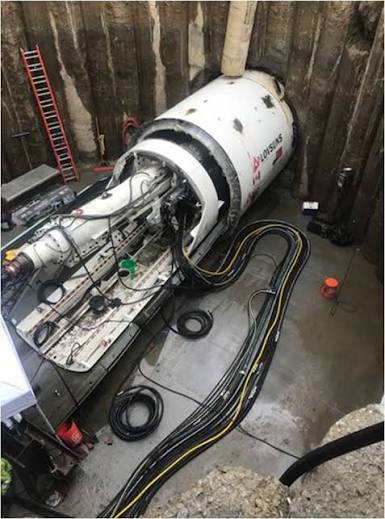
What happens: you dig one pit to start from and one to arrive at. Hydraulic jacks in the starting pit push a cutting shield forward through the soil, and behind it push in the tunnel segments one at a time, like adding sections to a drinking straw already stuck in a cake.
Think of it like: pushing a pipe under a driveway instead of digging the driveway up — the same idea, at city scale.
| Speed | 2.3 metres a day counting the whole operation; about 2.7 m/day while actively jacking. |
| Disruption | Minimal between the pits — but the pits themselves are large and sit in the street. |
| Cost | Most expensive per metre. Roughly half again the cost of open-trench work for the same tunnel. |
| Use it when | You must cross under something that cannot be disturbed — a river, an expressway, a rail line, a runway, a heritage street. |
In the Philippines there is a fourth consideration: only cut-and-cover uses precast concrete that can be made locally. Boring and jacking machines are imported, which adds cost, shipping time, and a dependency on foreign crews and spares.
The heading on that table is "Walk-in class (2.5 ≤ D ≤ 4.5 m) — itemized per 100 m." Four separate ideas are packed into that line. Here they are one at a time.
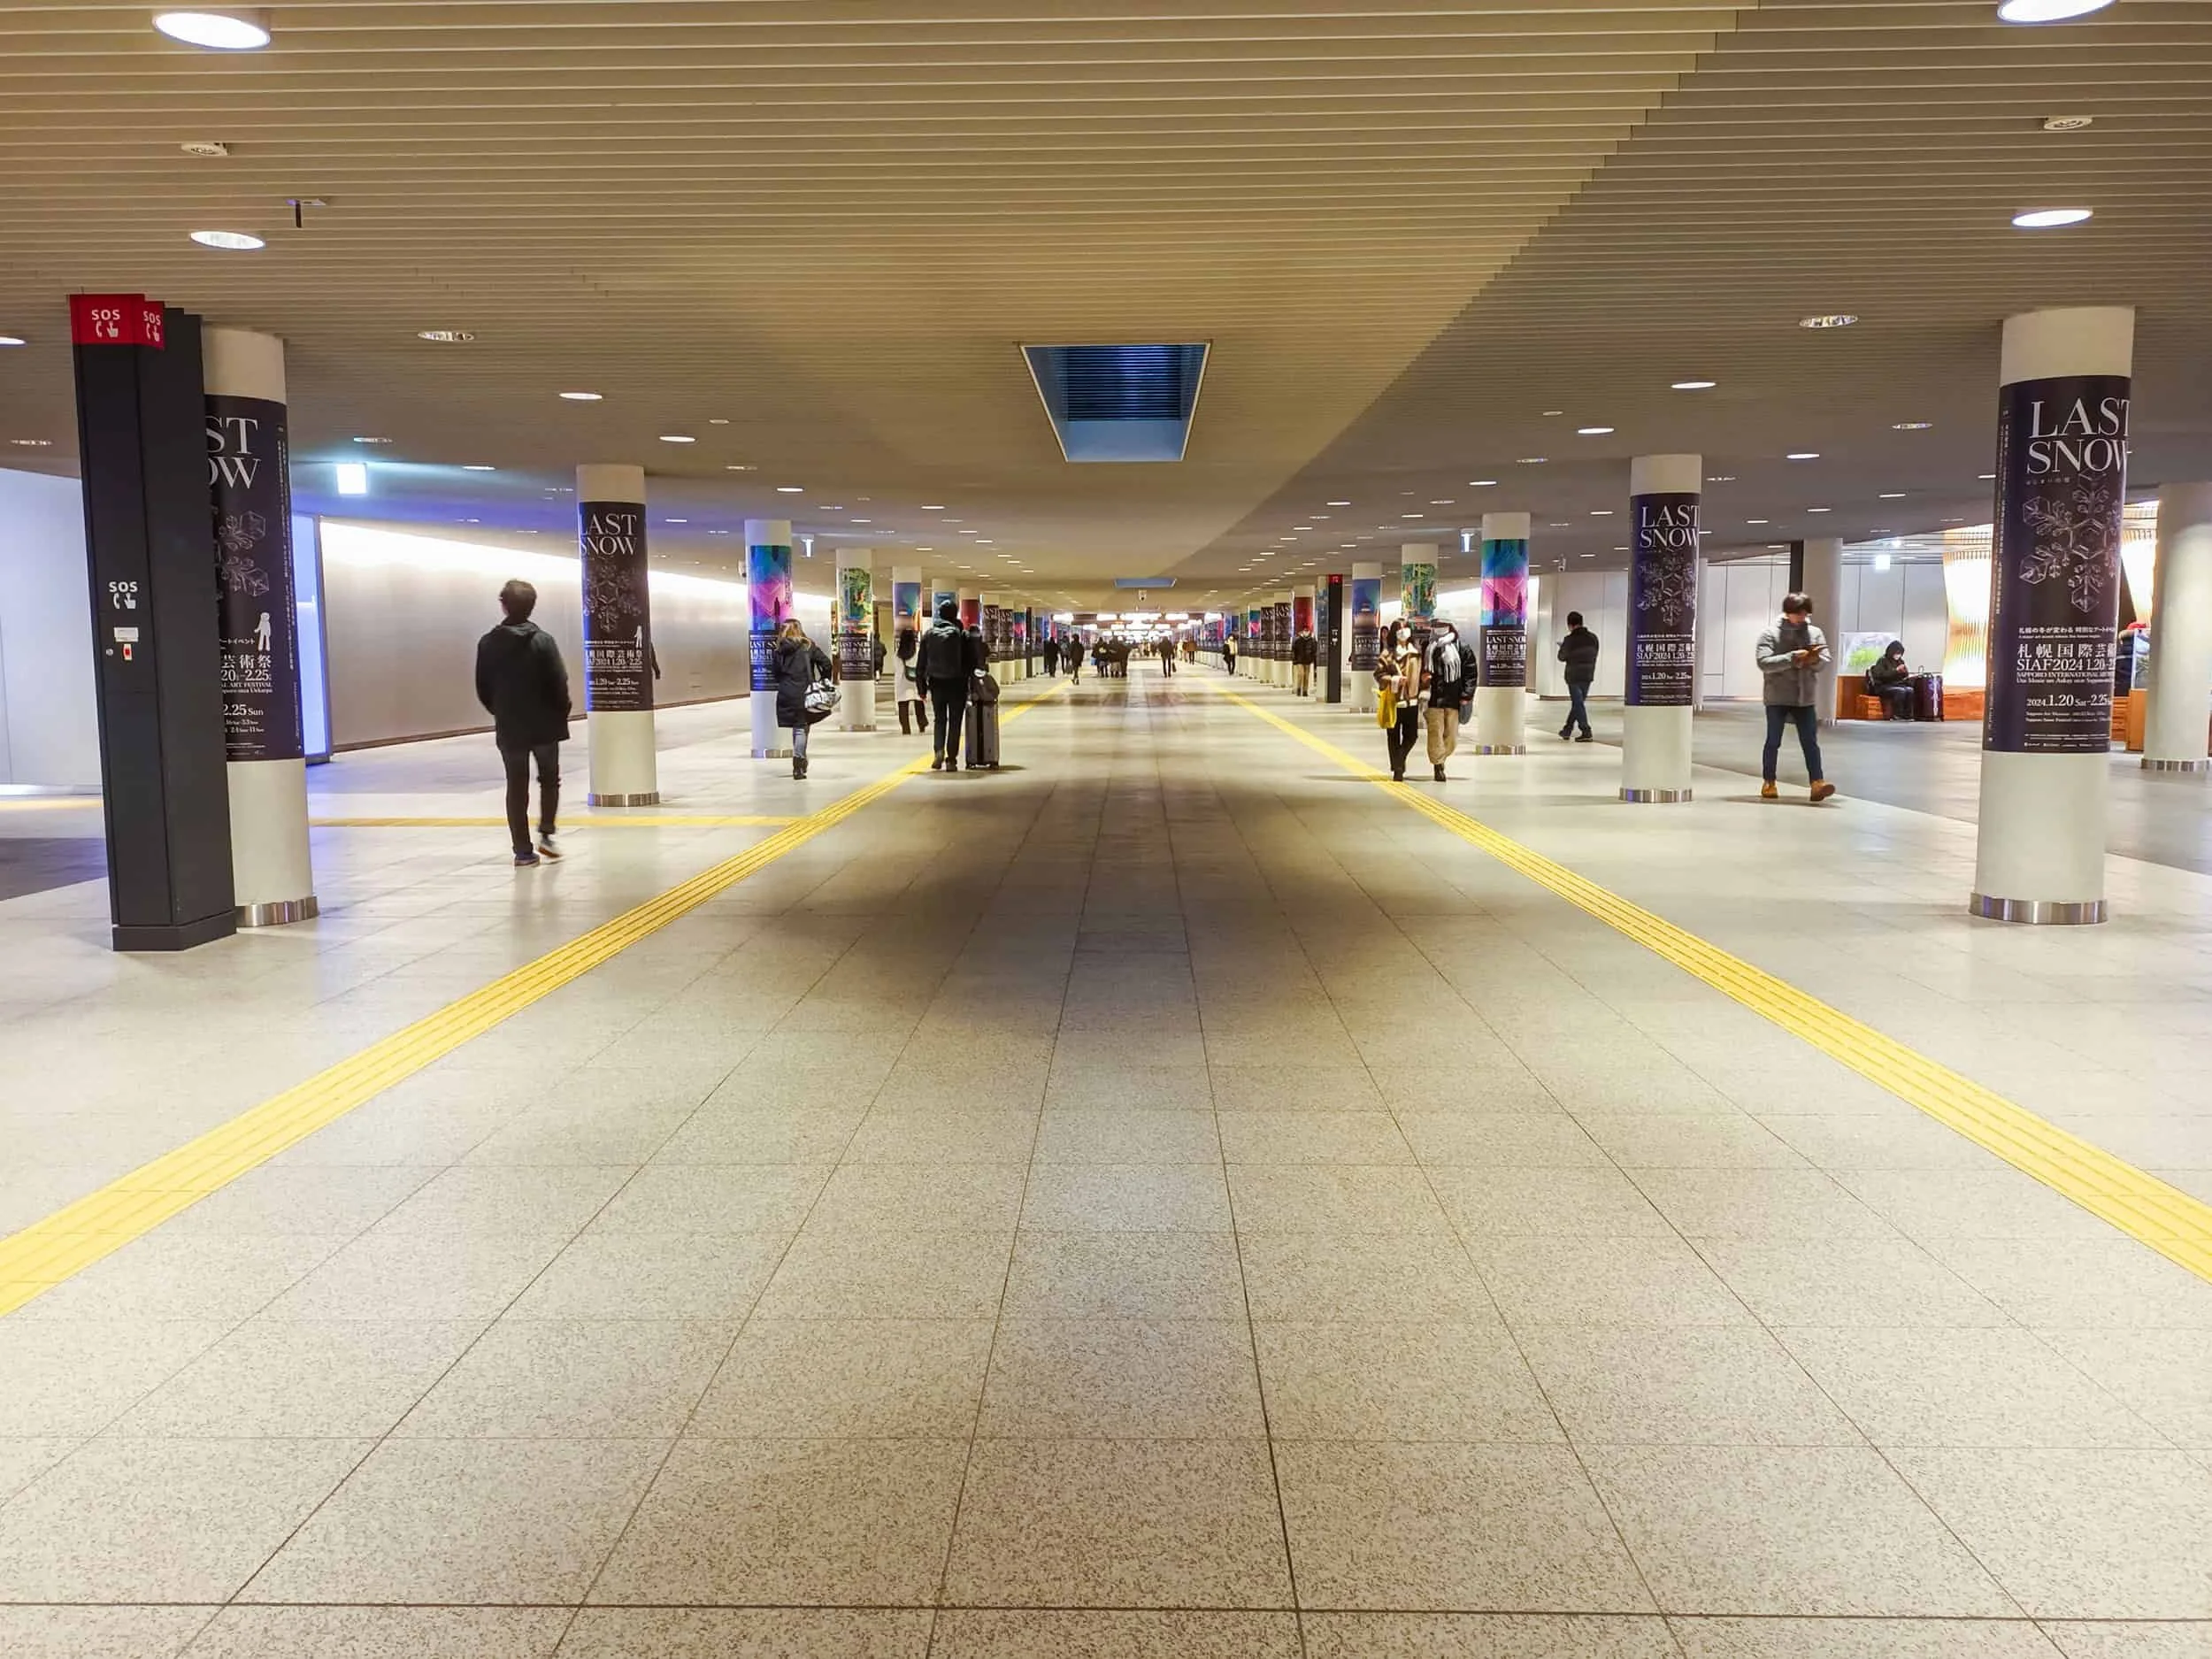
Tunnels are sorted into size bands. Walk-in means exactly what it sounds like: big enough for a maintenance crew to walk down the middle standing upright, with the pipes and cables racked along the walls. That is the whole point — a fault gets fixed by someone walking to it, not by digging up the road.
D is the internal size of the tunnel, and the expression means "between 2.5 and 4.5 metres." For scale: 2.5 m is about the ceiling height of an ordinary room. 4.5 m is roughly a storey and a half — comfortably taller than a delivery van. Smaller than 2.5 m and nobody can work inside it; larger than 4.5 m and you are into trunk tunnels that carry vehicles or people as well.
The cost is broken into its parts instead of being quoted as one lump. That matters because the same tunnel gets quoted two very different prices depending on whether the pipes inside are counted.
Costs are given for a 100-metre length — about one city block, or the length of a football pitch. Engineers usually quote per kilometre, but a per-kilometre figure is hard to picture and nobody builds a kilometre at a time. Multiply by 10 for a per-kilometre number.
| Row in the table | What it actually is |
|---|---|
| Cut-and-cover body + appurtenances | The empty concrete tunnel, plus everything that makes it usable but isn't a utility: access shafts and ladders, lighting, ventilation fans, drainage sumps and pumps, fire doors, gas and smoke sensors. "Body" is the shell. "Appurtenances" is the fittings. No pipes or cables yet. |
| In-tunnel pipelines | The actual services that go inside — water mains, power cables, telecom and fibre, and the steel racks and brackets holding them. This is a separate line because the tunnel owner and the utility companies are usually different parties paying different bills. |
| Total, China national average | Both of the above together, averaged across Chinese projects. MOHURD is China's Ministry of Housing and Urban-Rural Development, which publishes the national figures. |
| TBM, soft ground (UK 2016/17) | A UK government benchmark for bored tunnels of this size, at 2016/17 prices. Useful because it is an independent, non-Chinese cost check. |
| Cut-and-cover, Ø3 m (Montreal) | A university simulation of a 100 m, 3-metre tunnel. Ø just means diameter. The computer built the tunnel thousands of times with random variation in weather, breakdowns and productivity, which is why the answer is a range and not one number. |
| Microtunnelling, Ø3 m | The same simulated tunnel, built the jacking way instead. The two rows are the fairest like-for-like comparison in the whole table, because everything except the method is identical. |
The cost table compares six very different things. They are not six versions of the same tunnel, and the price differences are mostly explained by what each project was for.
電線共同溝 · denden kyōdōkō · from PHP 145 M/km
The cheapest thing on the list, because it is the smallest. Japan has spent decades removing overhead power and telephone poles from its streets, and the standard solution is a shallow duct under the footpath carrying only power and telecom cables — no water, no gas, no walk-in access. Tokyo has done over a thousand kilometres of it.

無電柱化 (pole removal) programme pages.
Wikipedia: Undergrounding.综合管廊 · from PHP 700 M/km
Since 2015 China has run a national pilot programme putting all utilities into shared walk-in galleries in new city districts. The two Chinese figures in the table are the same tunnel counted two ways: PHP 700 M/km for the empty concrete box, and PHP 1,050 M/km once the pipes and cables inside are included. If you only remember one thing from that table, make it this: always ask which number you are being quoted.

Utility tunnel.PHP 2,660–3,930 M/km — the most expensive here
A deep, large, fully integrated tunnel network under Singapore's new downtown, built at the same time as the land was reclaimed, before the towers went up. It carries power, telecom, potable water and the chilled water for the district cooling system that air-conditions the whole district. It is expensive because it is large, deep, includes the services inside, and was built to serve a premium financial district — not because Singapore overpaid.
Marina Bay, Singapore.PHP 577 M/km — the cheapest full network
A 33.4 km network built across Hengqin Island next to Macau, finished in 2013, and the reason this option is taken seriously at all. It was built on open ground before the city arrived, which is why it is so cheap. It carries the five high-voltage circuits that supply Macau — which ran without interruption through two major typhoons — and the project credits it with freeing about 400,000 m² of land that would otherwise have been tied up in separate easements.
Hengqin.PHP 632–1,184 M/km
Not a project — a cost dataset. The UK Infrastructure and Projects Authority and the British Tunnelling Society collected what bored tunnels of this size actually cost across many British projects. It is in the table as an independent sanity check: if the Chinese and UK numbers land in the same range, neither is an outlier.
PHP 986–1,872 M/km
Also not a built project. Researchers at Concordia University in Montreal modelled the same 100 m tunnel built two different ways and ran it thousands of times. This is the only genuinely like-for-like comparison available, and it is where the finding comes from that jacking takes about 38% fewer working days but costs about 48% more than open trenching.
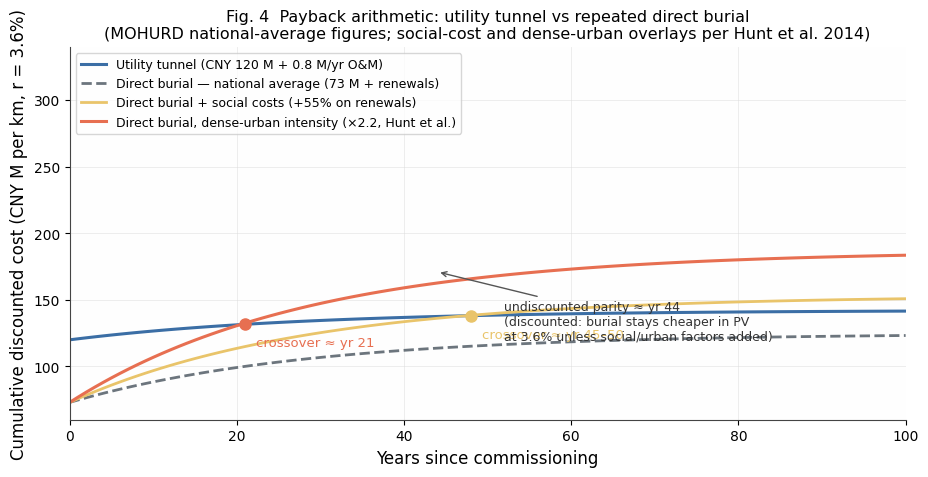
What it says: add up fifty years of costs. Building one shared tunnel comes to about PHP 1.40 billion per kilometre. Burying seven utilities separately and then digging them up again and again over those fifty years comes to about PHP 1.45 billion.
What it means: over half a century, the two approaches cost roughly the same. The tunnel is not a bargain over that horizon — it is a tie. The difference is when you pay: the tunnel costs much more up front and much less afterwards; burial is cheap to start and expensive forever.
What it says: stretch the same comparison to a hundred years and the tunnel comes to about PHP 1.75 billion per kilometre against PHP 2.27 billion for repeated burial.
What it means: the tunnel wins by roughly a quarter — but only if you are willing to count a century. Buried pipes get replaced two or three times in that period; the concrete tunnel is designed to be there the whole time and you replace only what is inside it. Whether a hundred-year horizon is a fair basis for a decision is a political question, not an engineering one.
What it says: on a busy city street where the road gets opened often, doing it the old way ends up costing between 1.32 and 2.2 times what the shared tunnel costs.
The trap: "132–220% of" is not "132–220% more than." The first means up to 2.2× as much. The second would mean 3.2× as much. This sentence is misread constantly, including in earlier drafts of this material.
What it says: for every PHP 100 on the contractor's invoice for open trenching, another PHP 30 to PHP 80 of real cost lands somewhere else.
What those costs are: drivers stuck in the detour burning fuel and time. The carinderia beside the trench losing three months of customers. Dust, noise, vibration. Accidents around the works. Pavement that never quite recovers. Nobody invoices for these, so they are usually left out of the comparison entirely — which quietly stacks the deck in favour of digging the road up again.
Money in the future is worth less than money today — you could have invested it, and there is always a chance you never see it. Economists convert future money into today's money using a discount rate. At the 3.6% rate used here, PHP 1 saved fifty years from now is worth about 17 centavos today.
This is why a tunnel can "break even in year 44" on a simple count and still look like it never breaks even once discounted. Both statements are true; they are answering different questions. Discounting is why the payback numbers in Part 5 come in pairs.
No — and the honest answer is more interesting than the number.
48 years is one specific scenario, not the answer. It assumes an average Chinese corridor, an average rate of road-opening, social costs counted, a 3.6% discount rate, and the utility tunnel on its own with nothing else built alongside it.
Change the corridor and the answer moves enormously:
| Situation | How often the road gets opened | Payback |
|---|---|---|
| Ordinary corridor, direct costs only | About once per utility per 12 years | Never catches up, once discounted |
| Ordinary corridor, social costs counted | Same | ≈ 48 years discounted (≈23 undiscounted) |
| Dense corridor, frequent digging | Roughly once per utility per 5 years | ≈ 21 years discounted (≈14 undiscounted) |
| Very dense corridor | Once per utility every 3–4 years | ≈ 5–6 years undiscounted |
You asked about retail income, transit foot traffic and climate. All three are real, all three are missing from that number, and each pulls the payback in the same direction — shorter. Here is how each one would enter the calculation, and what is honestly known about it.
Not counted at all. The 48 years covers the utility corridor and nothing else.
Concourse rent is a genuine annual income stream and it can dominate the arithmetic — but it comes with its own construction bill, which the utility figures also exclude. The honest position is that nobody has costed a combined facility in this evidence base. Both the revenue and the extra capex are yours to estimate.
Not counted — and the causality runs the other way.
Every Asian concourse that works commercially is attached to a station. Passengers create the footfall; the footfall creates the rent. The utility tunnel contributes nothing to that. So this is a real revenue source only where there is transit, and the fare revenue itself belongs to the transit operator, not the tunnel.
Not counted. Probably the largest unpriced item.
Power that stays on through a typhoon has a measurable value — utilities already price it as cost of unserved energy. Add avoided flood damage to cables and switchgear, avoided emergency repairs, and the value of a cooled public space during a heat event. These enter as an annual figure: expected damage avoided per kilometre per year.
Not counted. One-off, potentially very large.
Hengqin credits its network with freeing 400,000 m² of land. In Metro Manila, land freed from utility easements is worth more than anywhere in the model this came from. Enter it as a one-off reduction in the upfront gap rather than an annual income.
The whole calculation is simpler than it looks. There is a gap — the extra amount the tunnel costs upfront compared with just burying everything, about PHP 410 million per kilometre. And there is an annual saving. Divide one by the other and you have the payback in years. Everything above is just an argument about what belongs in the annual saving.
Undiscounted simple payback. Discounting at 3.6% pushes the answer out — roughly doubling it in the slower cases, and barely changing it in the fast ones. The two rent and resilience boxes start at zero deliberately: those are your numbers to supply, and nothing in the source research supplies them for you. For where to plug in real figures, see Part 6 — concourse rent is published in transit-operator accounts (Taipei Metro, SBS/SMRT, Japan's chikagai operators), and resilience is priced as cost of unserved energy.
The single most useful thing to take from all of this: the payback arithmetic on a standalone tunnel is the wrong frame, for two separate reasons. The first is here: the project that makes a utility corridor and an underground retail concourse cheap is the project you are already building — the subway. The second is Part 7: this is not the kind of asset that is supposed to pay for itself at all.
Build the subway, and plan the utility services tunnel and the shops into it before the alignment is frozen. The people doing the digging, the land, the closed roads and the retail footfall are all already there. Adding a utility corridor and a concourse alongside is a small extra on a job that is happening anyway — not a new project with its own hole in the ground. The rents are a real income stream that the standalone number never counts.
Every benchmark network that came in cheap was built with something else: Marina Bay with the land reclamation, Hengqin on open ground before the city arrived, Xiongan with the street grid itself. Cheap is decided before the tunnel line and the planning permits are fixed — not during construction. Once the alignment is frozen, the chance is gone.
Land near a new station reprices on announcement, not on opening. If the developer's obligation to connect — and the bonus floor area in exchange — is written into the planning consent before that repricing, the city captures some of it. Written afterwards, you are negotiating against owners who have already banked the uplift. That timing is worth more than most of the construction savings.
The station boxes are large, shallow excavations right in the middle of the busiest commercial land. The road is already closed, the right of way is already taken, and the traffic management is already paid for. That is exactly where a concourse and a utility gallery are marginal cost — the extra concrete, the services inside it, the access shafts. The crossovers, portals and ventilation shafts are the same.
This is the piece most people get backwards. A subway TBM bores a round tunnel 6 metres or more, 15–30 metres down. A utility distribution corridor needs to be 3–6 metres down, because services branch sideways into every building every few metres. You cannot run a water main or a distribution feeder from thirty metres below and branch it up to every building — the connection shafts alone would cost more than the corridor.
Deep bored tunnels are genuinely good for trunk transmission — a high-voltage cable route, a bulk water main, a fibre backbone between substations. That is a real use, and it is what Hengqin's separate power tunnel does. But it is not the shared corridor that stops the road being dug up.
What actually transfers from a subway TBM contract is the supply chain, not the machine: the mobilised contractor, the trained crews, spoil handling, grouting plant, survey control, site logistics, and the ground-conditions dataset. That is real and worth money. It is not the same as the machine being available.
In the cost tables, cut-and-cover precast is both the cheapest per metre and the only method fully producible in the Philippines. The TBM is the imported item carrying the ×1.3 uplift, the import lead time, the foreign-crew dependency, and no second machine if the first is held up. So flip the usual instinct: the locally-producible, cheapest element is the enabler, and the imported, schedule-risky one is the exception.
The rule: bore where you must (long, deep, or under a line you cannot touch), precast cut-and-cover wherever the surface allows, and jack only at genuine obstacles.
Utility-tunnel literature never prices concourse retail, but transit operators publish it. The strongest leads: Taipei Rapid Transit Corporation breaks out non-fare revenue including rent from the underground malls (Zhongshan, Taipei City Mall, East Metro Mall) and is known for a high non-fare share; SBS Transit / SMRT (Singapore) report rental and advertising as a segment covering station retail; and Japan's chikagai are run by dedicated operating companies (Yaesu, Crysta Nagahori, Sakae), some of which file accounts. Pull rental revenue, leasable area, and revenue per m² per year — that fills the blank the calculator leaves for rent, from comparable Asian cities rather than a guess.
Power that stays on through a typhoon has a measurable value — utilities price it as cost of unserved energy. Add avoided flood damage to cables and switchgear, avoided emergency repairs, and the value of cooled public space during a heat event. It enters as expected damage avoided per km per year.
Subways go where passengers are; utility congestion is where buildings and old services are. Those overlap along the major arterials and diverge everywhere else. So the marginal-cost play works on the station-adjacent segments and the shared arterial stretches — not across a whole city network. That is a smaller prize than the thesis implies, but a much more defensible one.
And it is a map you could actually draw: the subway alignment overlaid on excavation-permit density. Where the two lines coincide is where the argument just made is strongest. The Metro Manila Subway's contract packages, alignment depth and station-box dimensions are the data that would turn this from a thesis into a number.
Everything up to here has been answering a question that, for this class of asset, nobody in the world actually asks.
Mass transit does not pay for itself. Arterial roads do not pay for themselves. Neither do water mains, drainage, seawalls or the power grid. They are not built to. They are built because an economy without them is smaller — and the return arrives as everyone else's output, not as revenue on the asset's own books. Almost no metro system on earth recovers its capital cost from fares; many do not recover their operating cost either, and are funded anyway, everywhere, on purpose. The systems that come closest — Hong Kong's rail-plus-property model is the standard example — get there by capturing the land value the line itself created, which is an admission that the value was never in the fares.
The commercial test — does this asset repay its own cost? — is the right question for a toll concession, a private mall, a data centre. It is the question a bank asks before lending against the asset itself.
The economic test — does the economy get back more than this cost? — is the question governments actually approve infrastructure against, and it is the only one that fits a shared utility corridor. Its output is a benefit–cost ratio: above 1.0 and the project is worth building, regardless of whether a peso of revenue ever lands on the asset.
The report we have been reading crosses from one test to the other and keeps using the first one's vocabulary. Look at what it actually found:
| What the report says | What it actually means |
|---|---|
| "Direct costs alone: the tunnel never catches up" | The asset does not recover its cost commercially. This is the expected result — a metro, a highway and a flood-control system all fail the same test. It is a finding about the test, not about the tunnel. |
| "Add social costs: crossover at year 48" | The moment you count traffic, closures and lost trade, you have stopped doing a financial appraisal and started doing an economic one. Those social costs are the wider economy. The analysis switched tests here without saying so. |
| "Hengqin: 400,000 m² of land released, BCR ≈ 3.6 on land alone" | A benefit–cost ratio — the economic-appraisal metric, and the strongest number in the whole study. It clears the approval bar by 3.6× before counting reliability, avoided disruption, or anything the corridor enables. This should have been the headline. |
None of this is revenue. All of it is the reason to build:
Demoting the payback frame is not the same as discarding the payback numbers. They do three jobs that the benefit–cost case cannot do on its own:
So the return is real. It simply lands on the country's books rather than the tunnel's — which is what an investment in infrastructure has always meant.
So the argument, in the order it should actually be made: this is infrastructure, and infrastructure is justified by the economy it enables. Build it into the subway and the major works already programmed for the corridor, because that is when it is cheapest to add (Part 6). The payback arithmetic in Part 5 is the conservative floor — it decides which corridor goes first, it prices the upkeep, it shows how quickly the savings start funding the next build, and it shows the case surviving even the mean version of the test. It is not the whole case. But it is a real return, and these funds go to growing the country — which is the only sense in which infrastructure has ever "paid off."
| File | Where | What it has to show |
|---|---|---|
| method-a-cut-and-cover.jpg | Part 1 | Crane lowering a precast box into an open street trench |
| method-b1-tbm.jpg | Part 1 | TBM cutting head, or bolted segmental rings inside a bored tunnel |
| method-b2-box-jacking.jpg | Part 1 | Jacking pit with hydraulic frame pushing a segment |
| walk-in-scale-diagram.svg | Part 2 | Cross-section with a standing person for scale — highest value item on this list |
| japan-cable-duct.jpg | Part 3 | Japanese street before/after pole removal |
| china-gallery-interior.jpg | Part 3 | Lit gallery interior, racked services, central walkway |
| marina-bay-cst.jpg | Part 3 | Marina Bay CST interior, or skyline with an explanatory caption |
| hengqin-network.jpg | Part 3 | Hengqin network map preferred over a photograph |
| payback-chart.png | Part 5 | Two lines and one marked crossing point — simplified from the report figure |
Every placeholder in this page uses the same dashed box and carries its intended filename, so they can be swapped one at a time without touching the surrounding text. Licence-check any stock imagery before it goes live.